
The Monitoring Report is a record of all sensor readings.
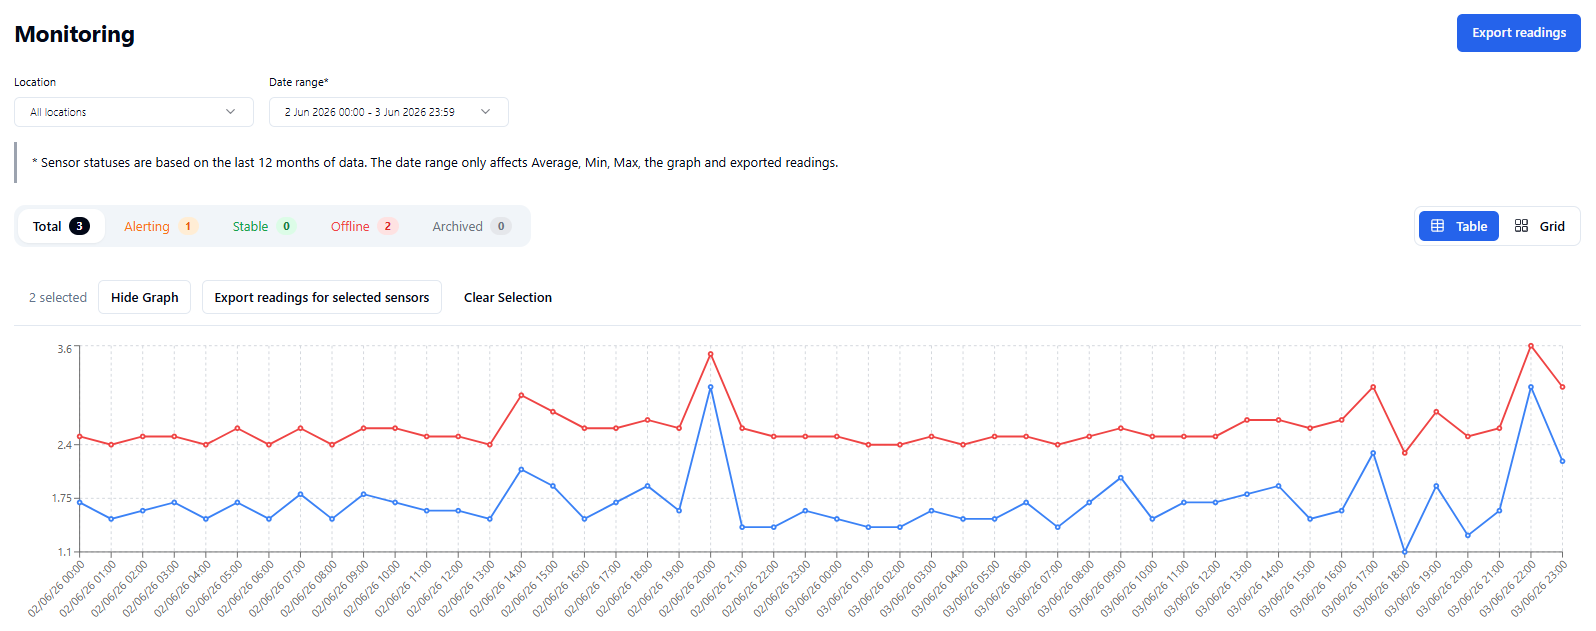
You can view data in tabular and graphical form and plot a graph comparing multiple sensors.
View the Report
-
Log in to the Control Centre.
-
Go to Reports > Monitoring Status.
-
Select Monitoring Status.
-
To view an individual sensor’s readings:
-
Click on a sensor to view tabular and graphical data.
-
Use the date field to filter data.
-
-
To plot a graph comparing multiple sensors' readings:
-
Check the boxes on the sensor.
-
Select a date range
-
Click Graph.
-
Report Contents
The report includes:
-
The sensor name
-
The sensor location
-
The sensor serial number
-
The type of sensor:
-
Temperature
-
Humidity
-
Contact
-
-
The value (reading taken)
-
The time the reading was taken (recorded in local time)
-
The upper/lower rule limit (displayed in green on the graph)
Export the Report
-
Log in to the Control Centre.
-
Go to Reports > Monitoring Status.
-
Select Monitoring Status.
-
Filter by location and date range.
-
Check the box on a sensor.
-
Click Export readings for selected sensors.
-
Click Export. The file will be saved to My Downloads.
-
Click Download to save the file to your device.
You can export up to 12 months of data.
Most exports are ready within 1 hour; however, it may take up to 24 hours if you are exporting a large amount of data.
You can view your data exports by clicking My Downloads in the side menu on the left. Files will be stored for 14 days, then automatically deleted.