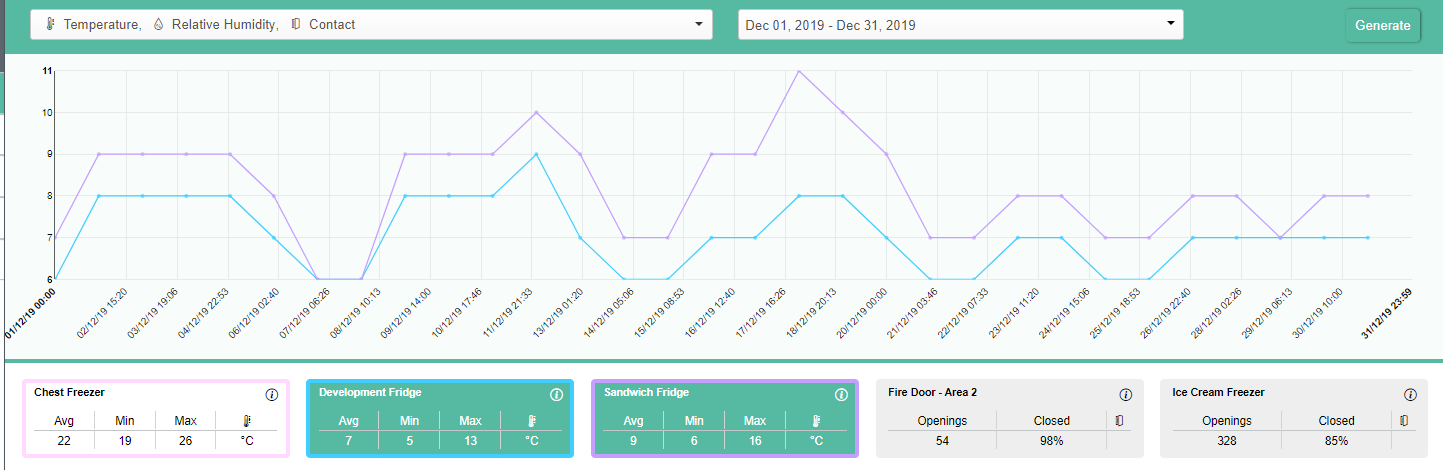
The Monitoring Summary Report is a diagrammatic record of sensor readings.
Click here to watch a video on the Monitoring Summary Report.
You can filter data by:
-
Sensor type (temperature, relative humidity, contact)
-
Date
The report contains tables that summarise the readings of individual sensors over the specified period.
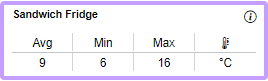
Temperature/humidity sensor readings are summarised as follows:
-
Average reading
-
Minimum reading
-
Maximum reading
-
Unit of measurement
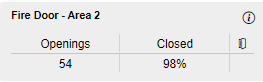
Contact sensor readings are summarised as follows:
-
Total number of openings
-
% of time closed
Click the i icon to view the sensor’s ID, serial number, and MAC address.
You can plot a sensor’s readings on a graph by clicking on a table. The line will appear the same colour as the table.
You can plot multiple sensors.