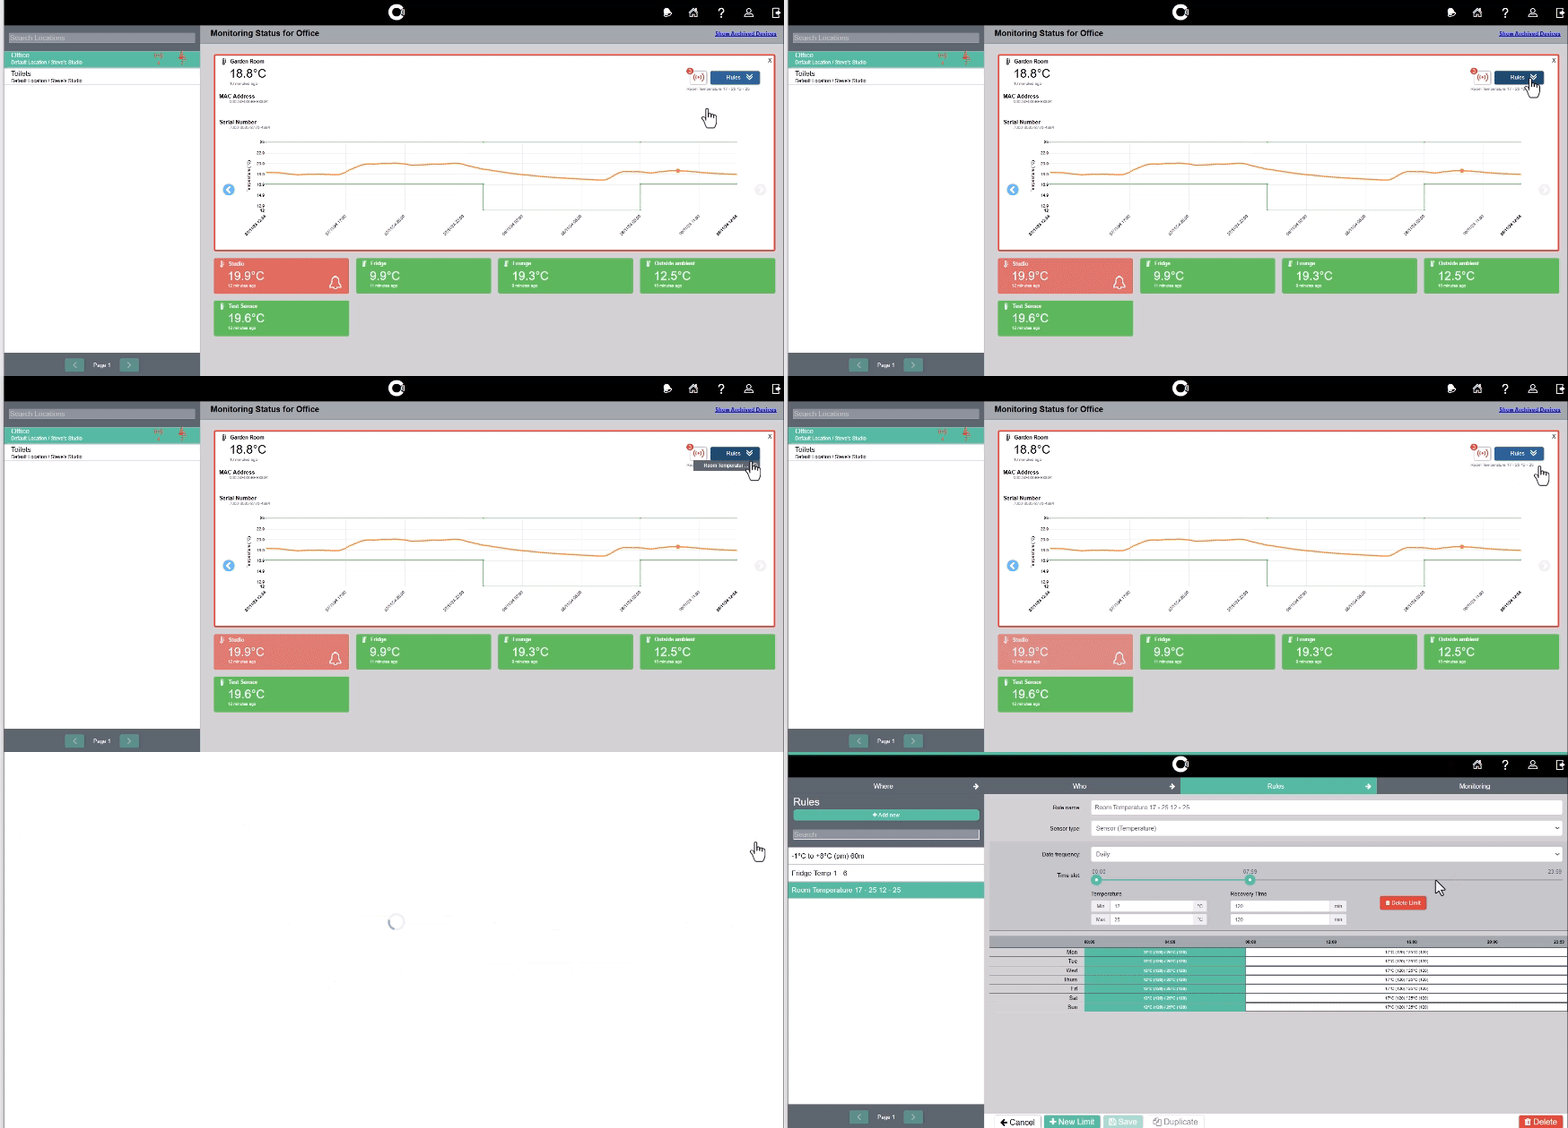
You can view sensor readings and alert status on the Automated Monitoring Status page.
To do so:
-
Log in to the Control Centre.
-
Go to Automated Monitoring Status> View Sensors.
-
Select a location from the panel on the left. You will see a list of sensors displaying the latest reading and when it was taken.
Sensors appear:
-
Green, if the sensor is not alerting
-
Amber, if all alerts on the sensor have been acknowledged, but not cleared
-
Red, if the sensor has any unacknowledged alerts
-
Black, if the sensor has not sent data to the Control Centre for longer than its alert delay period (see Sensor Troubleshooting to resolve the issue)
-
To view more details, click on a sensor. You will see:
-
The sensor MAC address
-
The sensor serial number
-
An alert icon specifying the number of alerts triggered by the sensor (if applicable)
-
A graph plotting the sensor’s readings, including:
-
Sensor readings in orange
-
An alert icon in green, amber, and red indicating cleared, acknowledged, and unacknowledged alerts
-
Upper and lower limits of rules in green
-
-


Use the blue left and right arrows to see earlier/later readings.
Click the alert icon to view/manage any alerts the sensor has triggered (see image 2).
Click on the Rules dropdown menu and cog icon to view/edit the sensor’s rule (see image 3).
