A Graphical Sensor Data Report is a record of an individual sensor’s readings in graphical form.
You can save a copy of the report to: the documents library, your device, or both.
You can also export the data within the report to Excel.
View a Graphical Sensor Data Report
-
Log in to the CAM+ Website.
-
Click the sensor icon on the relevant department.
-
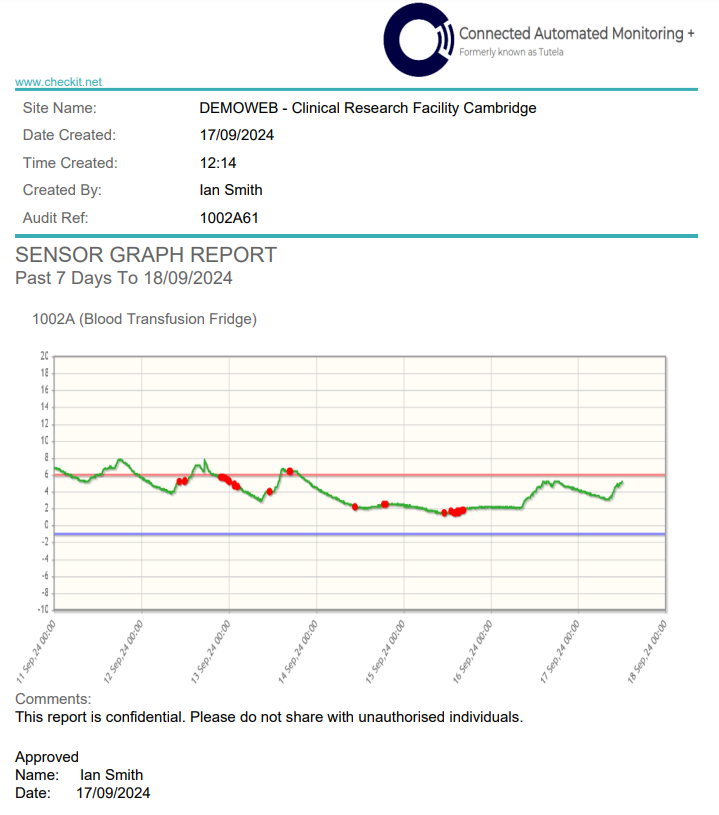
Click the graph icon on the sensor you want to view. You will see a graph displaying readings since 00:00 containing:
-
High alarm setpoint in pink
-
Sensor readings in green
-
Alarms in red (if applicable)
-
Low alarm setpoint in blue
-
Alert setpoints are not displayed in Graphical Sensor Data Reports.
You can click on an alarm to view the incident audit. See image 1.
-
Use the following fields on the left to filter data:
-
Calendar -to view readings from a specific date range & time
-
Hour - to view readings from a specific hour of a specific day
-
24 hours - to view readings from the last 24 hours
-
7 days - to view readings from the last 7 days
-
30 days - to view readings from the last 30 days
-
Turn on the Auto-Scale toggle above the top right of the graph to automatically adjust the axis limits, ensuring all your data fits perfectly within the view.
Use the left and right arrows to view readings from the previous/next day.
Click the table and graph icons to switch between the tabular and graphical view.
The Graphical Sensor Data report contains sensor readings at 5 minute intervals. Please contact us if you require a report containing sensor readings at 1 minute intervals.
Save a Copy of a Graphical Sensor Data Report
You must have the Manage Library permission enabled to save a file to the documents library. See View/Edit Your User Profile to check which permissions you have enabled.
-
Click Report.
-
(Optional) Add some comments to the report.
-
Click Confirm.
-
Select where you want to save the report:
-
To electronic library (to the documents library)
-
To printer (to your device)
-
To printer & electronic library (to both)
-
-
Click Confirm.
If you save a graphical sensor data report to the documents library, it will be filed under Documents Library> System Users>Reports Pending Secondary Sign Off
Export the Data in a Graphical Sensor Data Report
-
Click the Table icon to switch to the tabular view.
-
Click Export.
-
Select Values table.
-
Click Export.