The Alarm Dashboard displays all active sensor alarms in a department.
You must have the Access Dashboard permission enabled to view the Alarm Dashboard. See View/Edit Your User Profile to check which permissions you have enabled.
-
Log in to the CAM+ Website.
-
Click the sensor icon on the relevant department.
-
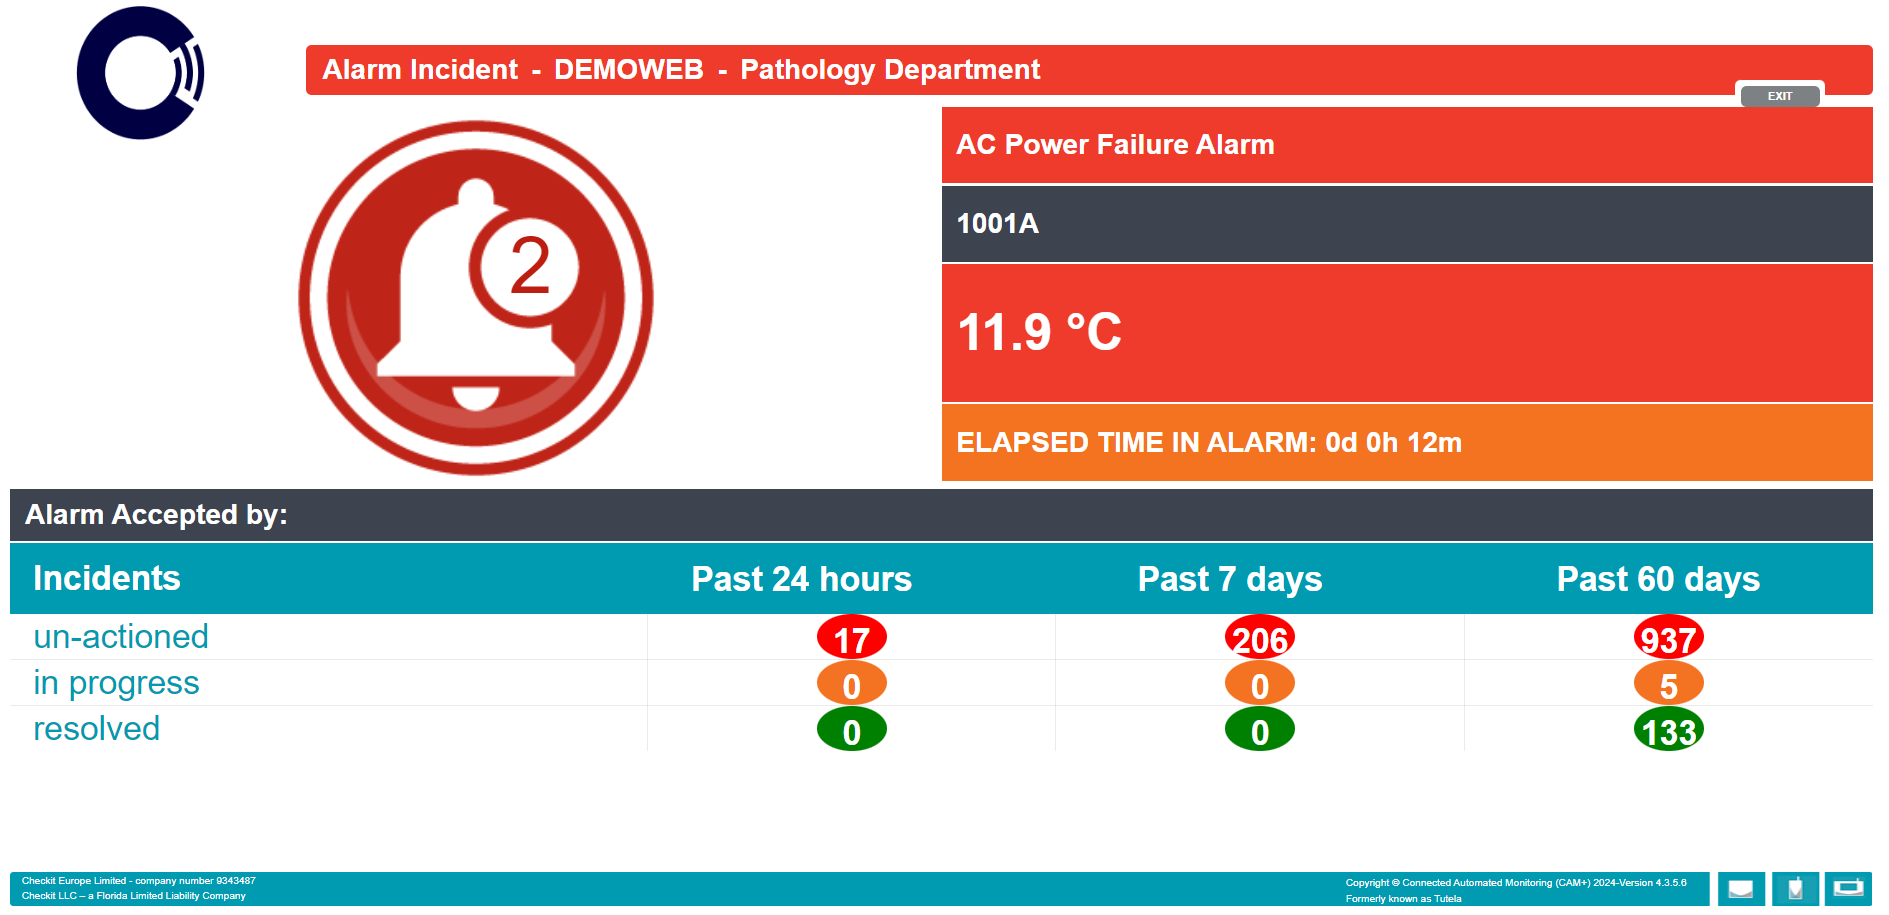
Click Dashboard Displays. You will see:
-
A scrolling list of sensor alarms on the top part of the screen with details including:
-
Type of alarm
-
Sensor number
-
Sensor reading that triggered the alarm
-
Elapsed time in alarm
-
-
A table on the bottom part of the screen displaying the total number of sensor alarms over the past 24 hours, 7 days, and 30 days divided by alarm stage:
-
Unactioned (with no fields of the incident audit completed)
-
Actioned (with the first or first and second fields of the incident audit completed)
-
Resolved (with the third field of the incident audit completed and awaiting sign off)
-
-
Click the back button on your web browser to return to return to the sensor list page.
See Sensor Alarms for a description of each type of sensor alarm.
See Complete an Incident Audit for instructions on how to record what you have done resolve an alarm.