You can view all sensors on the CAM+ Website.
To do so:
-
Log in to the CAM+ Website.
-
Click the sensor icon on the relevant department.
You must have the General Access permission enabled to view a department’s sensors. See View/Edit Your User Profile to check which permissions you have enabled.
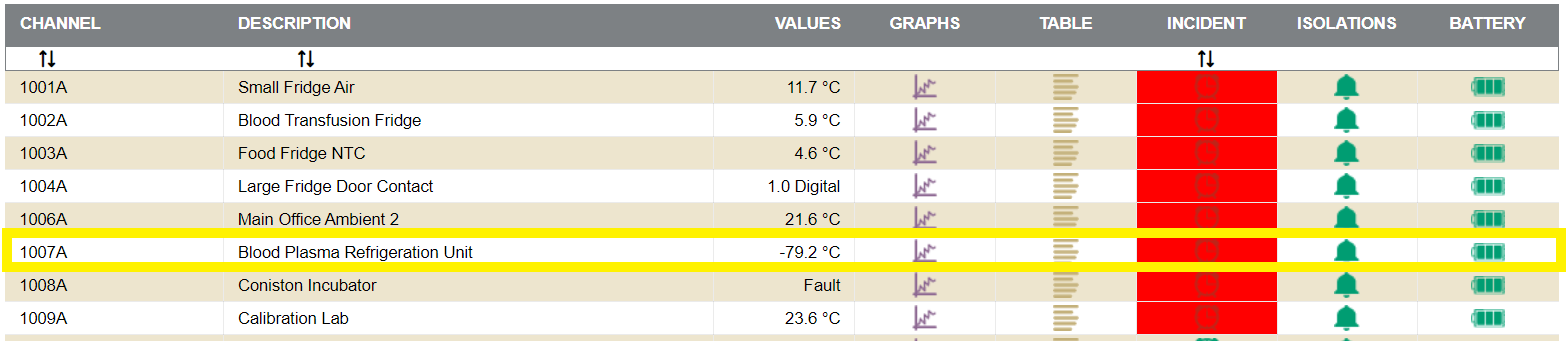
Sensor List Table
In the centre of the screen, you will see a table displaying all sensors in the department.
Each column provides information about a specific sensor or displays icons to view/edit its configuration, including:
-
Channel: the sensor’s number, for example, 1071A
-
Description: a description of the sensor, for example, Blood Plasma Refrigeration Unit Temperature Sensor
-
Values: the most recent reading
-
Graphs: click this icon to view the sensor’s Graphical Sensor Data Report
-
Table: click this icon view the sensor’s Tabular Sensor Data Reportand Sensor Summary Report
-
Incidents: click this icon to view and complete incident audits triggered by the sensor
-
Isolations: click this icon to view/edit the sensor’s isolations
-
Battery level: displays the current battery level of the sensor
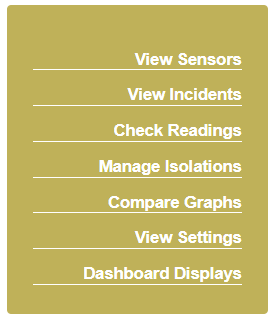
Side Menu
The side menu is located at the bottom left of the screen. It allows you to view information on/edit the configuration of all sensors in the department.
It contains the following buttons:
-
View Incidents: click to view all incidents triggered by all sensors in the department
-
Check Readings: click to check the current reading of all sensors in the department
-
Manage isolations: click to view/edit the isolations of all sensors in the department
-
Compare graphs: click to generate a graphical sensor data report comparing the readings of up to 8 sensors in the department
-
View settings: click to view/edit the high/low setpoints and delays of all sensors in the department
-
Dashboard Displays: click to view alarm dashboard (optional feature)