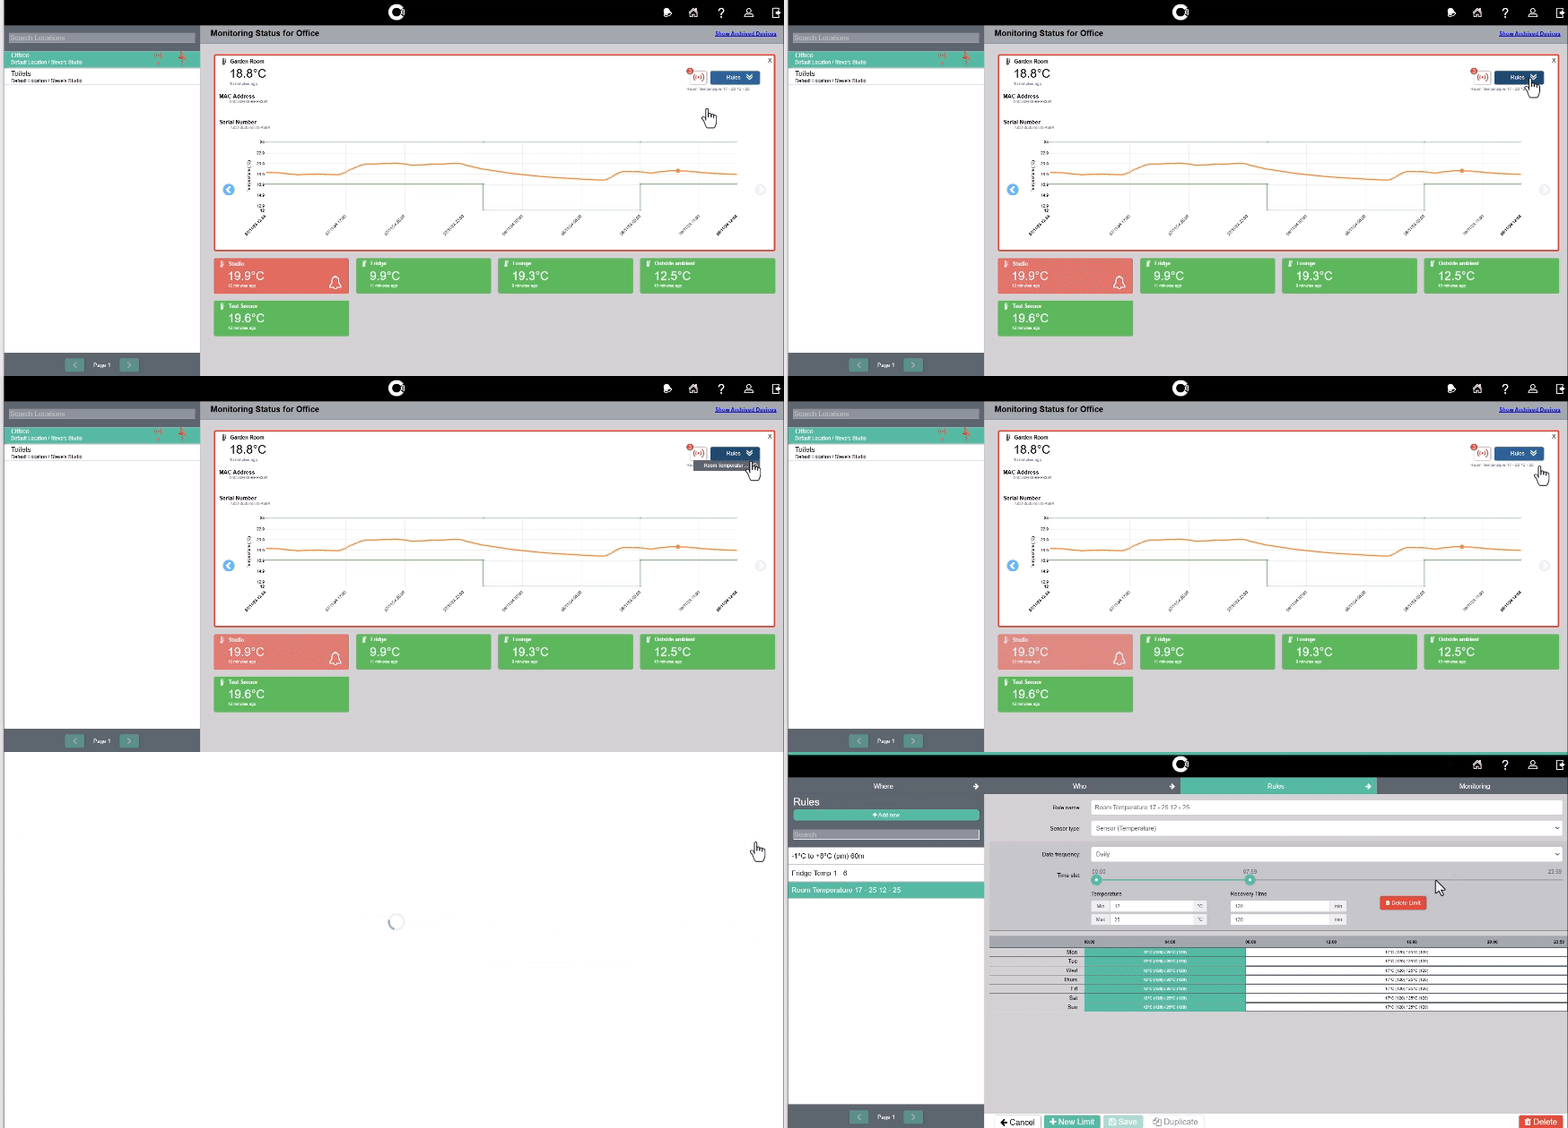
You can view sensor readings and alert status on the Automated Monitoring Status page.
To do so:
-
Log in to the Control Centre.
-
Go to Automated Monitoring Status> View Sensors.
-
Select a location from the panel on the left. You will see a list of sensors displaying the latest reading and when it was taken.
Sensors appear:
-
Green, if the sensor is not alerting
-
Amber, if all alerts on the sensor have been acknowledged, but not cleared
-
Red, if the sensor has any unacknowledged alerts
-
Black, if the sensor has not sent data to the Control Centre for longer than its alert delay period (see Sensor Troubleshooting to resolve the issue)
If you have received multiple service alerts indicating that all your sensors are offline, there is likely an issue with the Cloud Connector. See Cloud Connector Troubleshooting to resolve the problem.
-
To view more details, click on a sensor. You will see:
-
The sensor MAC address
-
The sensor serial number
-
An alert icon specifying the number of alerts triggered by the sensor (if applicable)
-
A graph plotting the sensor’s readings, including:
-
Sensor readings in orange
-
An alert icon in green, amber, and red indicating cleared, acknowledged, and unacknowledged alerts
-
Upper and lower limits of rules in green
-
-
Use the blue left and right arrows to see earlier/later readings.
Click the alert icon to view/manage any alerts the sensor has triggered (see image 2).
Click on the Rules dropdown menu and cog icon to view/edit the sensor’s rule.


