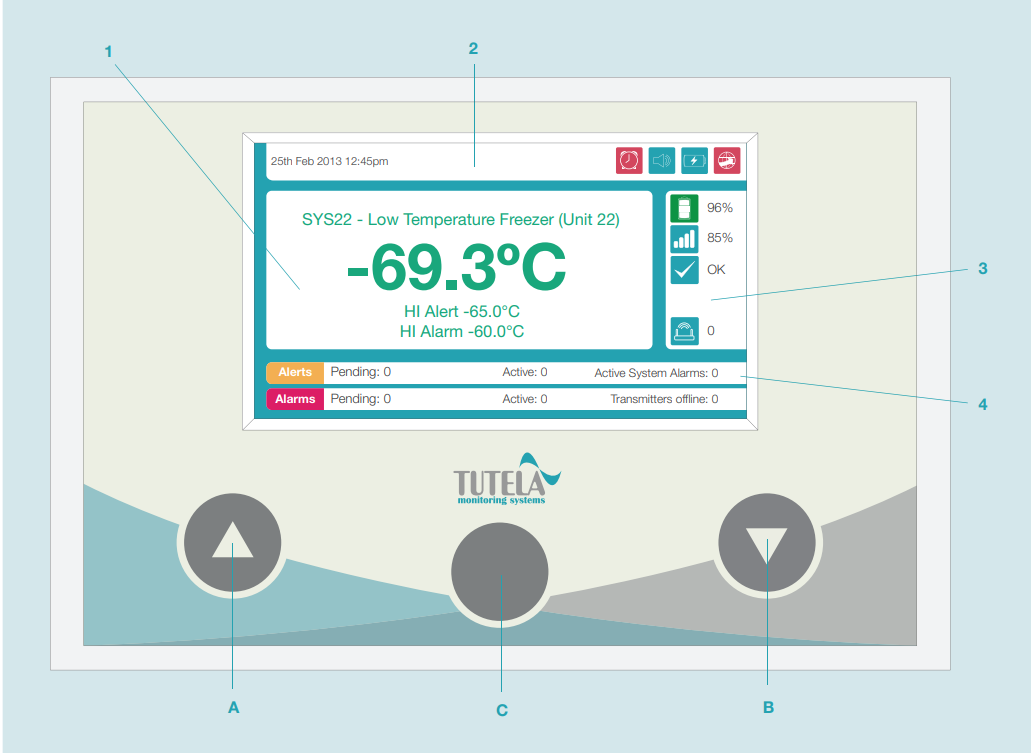
Display Panel
The display panel consists of 4 parts:
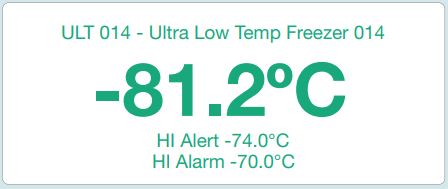
1. Current Sensing Probe Values
This section is located in the centre of the display panel.
It automatically scrolls through sensors and displays:
-
The sensor name
-
The most recent reading
-
High and low alarm thresholds (and alert thresholds if applicable)
See image 2.
The reading will appear:
-
Green if there are no active sensor alarms/sensor alerts
-
Red if there is an active sensor alarm
-
Amber if there is an active sensor alert
If a sensor is temporarily unable to communicate with the WARP, the message ‘SEARCHING’. will be displayed. See image 3.
If a sensor has lost communication with the WARP, the message ‘OFFLINE’ will be displayed. See image 4. If the issue persists, those on the department contact list will receive a transmitter offline alarm (see Transmitter Troubleshooting for instructions on how to resolve the alarm).


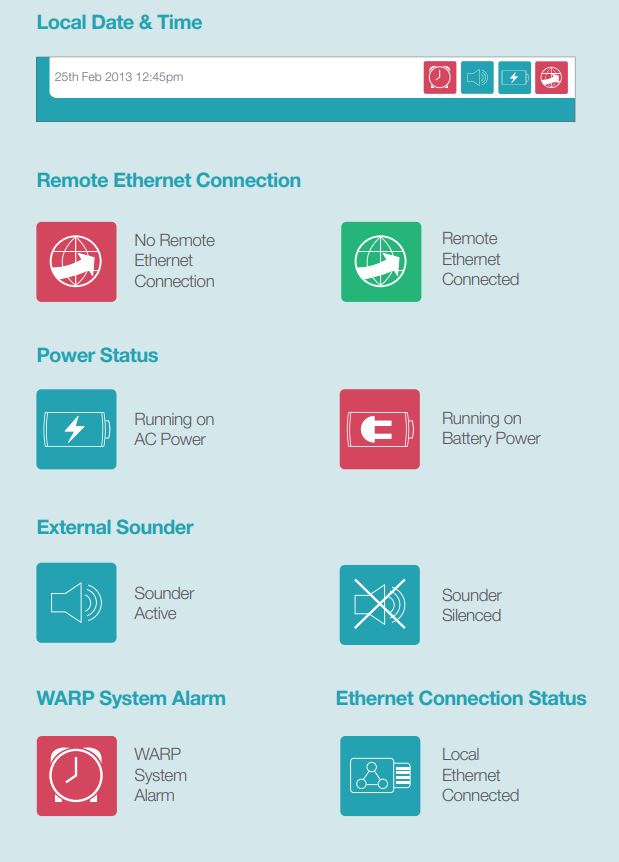
2. WARP Status
This section is located at the top of the display panel.
It displays the date & time, and icons indicating the WARP status.
See image 5 to view a description of each icon.
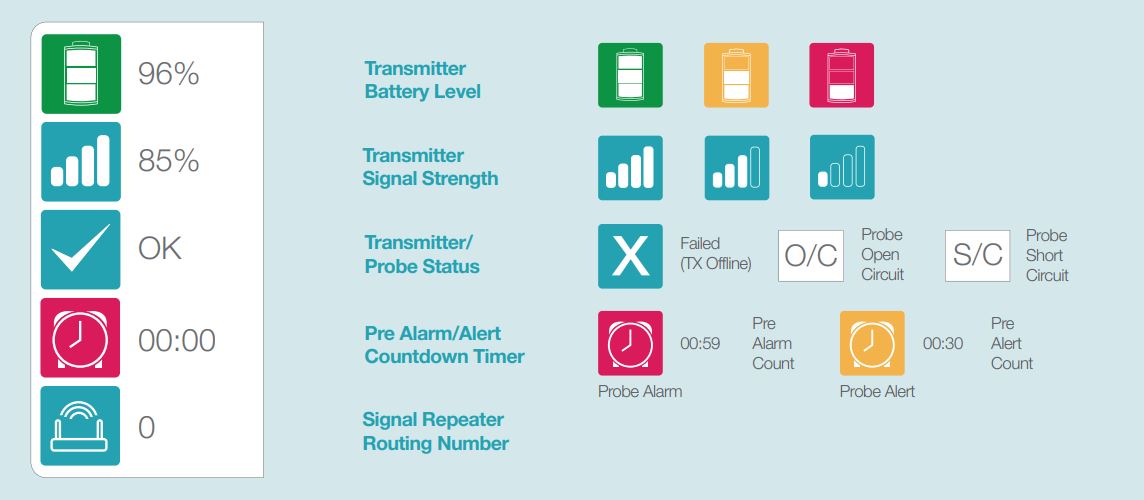
3. Wireless Transmitter / Probe Status
This section is located on the right of the display panel.
It displays icons indicating the status of the individual sensor currently being displayed.
See image 6 to view a description of each icon.
If a unit is out of range, an alarm countdown timer will be displayed (and alert if applicable). If the unit is still out of range when the timer reaches 00:00, and alarm/alert will be triggered.
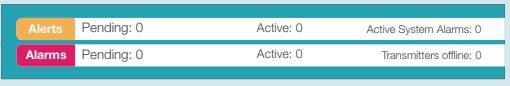
4. Current Alarm and Alert Status
This section is located on the bottom of the display panel.
It displays the following:
-
Pending (the number of sensors currently recording out of range readings and counting down to an alarm or alert)
-
Active (the number of probes currently in alarm or alert)
-
Active System Alarms (the number of active non sensor specific alarms generated by the WARP)
-
Transmitters Offline (the number of transmitters that are currently unable to communicate with the WARP)
See image 7.
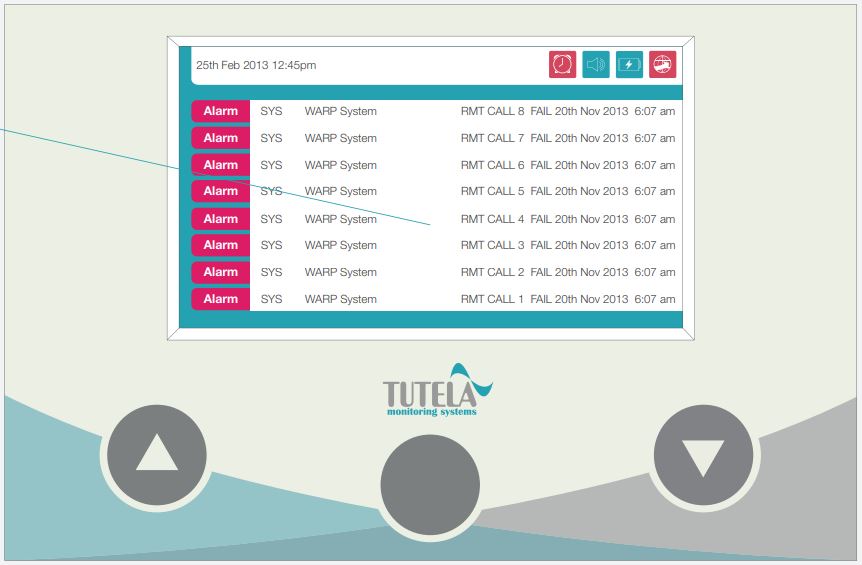
To view a table showing details on individual alarms/alerts (see image 8), press the centre membrane button twice in succession.
To return to the previous view, press the centre membrane button twice in succession again.
If the WARP display is left in the alarm table mode then, after a short time, it will automatically return to the main display.
Buttons
The WARP contains 3 buttons:
A. Scroll Up
Press and hold to freeze scrolling sensor readings.
Press and release to return to the previous sensor reading.
B. Scroll Down
Press and hold to freeze scrolling sensor readings.
Press and release to go to the next sensor reading.
C. Membrane
Press once to silence the audible sounder.
Press twice to view more details on alarms and alerts.